


In recent months, we have explored issues such as MPS costs, performance and even service delivery – but let’s now return our attention to what the managers are actually doing in their portfolios. In this piece, we will take a closer look at the asset allocations in the Defaqto Comparator Balanced peer group.
Our analysis draws on Defaqto’s proprietary Balanced Comparator volatility-based peer group, including the active and passive sub-peer groups derived from the wider Defaqto MPS Comparator universe of almost 130 DFMs and some 3,000 platform and direct portfolios, which ensures an unrivalled, detailed view of the MPS market.
Of course, most MPS managers are faced with keeping their portfolios broadly within a range of volatility in order to maintain them in line with the investor’s own attitude to risk. That said, a whole series of events around the globe have meant certain assets have been dropping in and out of favour over quite short periods.
A key question is, then, have MPS managers been trying to anticipate the markets or have they shut out the short-term noise and kept strictly to their longer-term strategic asset allocations? Here, a good place to start is where we are now – let’s call it the end of Q3 2026 – and compare it with where we were in Q4 2024, seven quarters earlier:
“Have MPS managers been trying to anticipate the markets or have they shut out the short-term noise and kept strictly to their longer-term strategic asset allocations?

Source: Defaqto
What we can see from the above table is a shift away from both domestic debt and domestic equity – primarily in favour of Global (ex UK) debt and US equity.
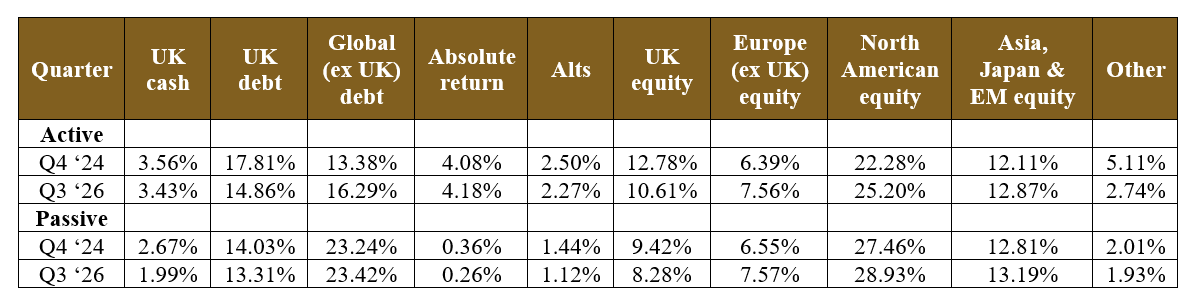
From here, the first question that springs to mind is whether it makes a significant difference if the portfolios are active or passive, which we would define as at least 90% underlying tracker funds – excluding cash. The following table duly splits that out:
Source: Defaqto
As we can see, the general shift in asset allocation broadly follows the same direction, whether active or passive. It is interesting to note that for passive portfolios, however, the moves are less aggressive – only a slight reduction in UK debt and a marginal increase in Global (ex UK) debt.
On the equity side, again, we see a slight reduction in UK equity with slight increases in other equity categories. In some respects, this is not surprising and the clue is in the name – passive. Active managers may be more inclined make more significant moves, backing their judgement.
Of course, we are dealing with averages here, so the next question would be whether those deviating from the average are being rewarded for their contrarian positions. Let’s therefore now take a look at the average asset allocations of only the top-quartile performers over the last year:

Source: Defaqto
Here, it is notable that the top performers have taken a more aggressive stance in some asset classes – for example, considerably underweight in Global (ex UK) debt (by 415bps) and a bit more aggressive in both UK (by 271bps) and US equity (by 239bps). The biggest overweight difference, however, is in the Asia, Japan and emerging markets equity class (by 379bps).
While the immediate temptation might be to take this evidence as an argument for more active management, let’s just look at the asset allocations of the bottom-performing portfolios in the Balanced sector:

Source: Defaqto
It is noticeable from this table that the bottom-quartile portfolios in the Defaqto Comparator Balanced peer group have maintained a significantly higher allocation to UK debt (by 595bps) than the overall Comparator average. Conversely, the most notable underweight is the equity exposure in Asia, Japan and emerging markets equity (by 347bps).
Of course, these are no more than just snapshots in time – and considered over a relatively short period as well – but it does show that something as simple as being overly aggressive or overly cautious can make a big difference to outcomes.
The breadth and depth of the due-diligence an adviser has to undertake before making a selection for a client continues to grow and this kind of analysis, which can be undertaken using Defaqto Engage, inevitably raises a number of further questions. Nevertheless, it will help to define an adviser’s thinking on the risk v reward angle.
It is well understood that the majority of returns attribution is down to good asset allocation, so it is important to understand the approach each portfolio manager takes. Do you want a manager that hovers around the averages, with a likelihood of average returns or do you want a manager that has the courage to back their convictions, perhaps sometimes being contrarian, which comes with a chance of outperformance but also a chance of underperformance if they get it wrong?
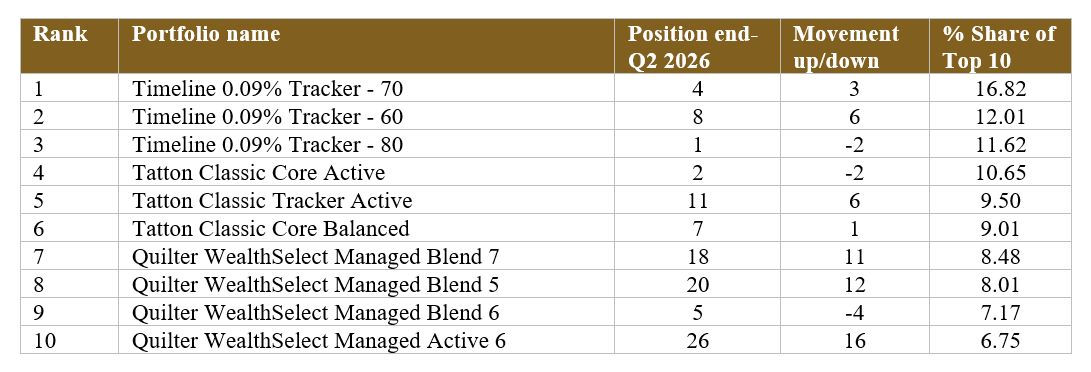
By way of rounding off this analysis, our final table shows the 10 most recommended MPS portfolios via Defaqto Engage adviser research software, by recommendation value for Q3 2026:
Source: Defaqto
Passive portfolios from Timeline hold the top three spots but it is notable the rest are all active options. As the table clearly indicates, for advisers the key dilemmas and decisions remain whether their choice should be active or passive, conviction or cautious.
Andy Parsons is head of insight at Defaqto