

So … 38 rounds of Premier League matches, 38 gameweeks of fantasy football and 38 columns casting around for ways to link all that with investment – primarily by constructing a ‘tracker’ portfolio of the most-owned ‘assets’ in the game and charting its progress, but also by keeping tabs on the trading behaviour of FPL managers through our ‘Herdwatch’ tables – and what have we learned?
Well, I am pretty sure we have confirmed the initial contention – first floated by Adam Lewis and me in our Back of The Net Asset Value podcast, may it rest in peace – that Fantasy Football can be used to explore a range of investment ideas, including asset allocation, value and behavioural finance. And I am absolutely certain we have confirmed I operate a pretty low threshold when it comes to what constitutes an ‘investment idea’.
I also know that, were I to continue the Mean Reversion Machine project into a second season, I would try to find more crunchable data. The official statistics have served us fine but, as I have mentioned more than once over the last 10 months, disillusioned FPL managers and a growing trend for ‘single-use’ teams mean the proportion of inactive squads grows larger each week – and that, of course, offers a distorted view of the market.
As an example, players that were highly owned in the opening weeks of the season have lingered in our portfolio longer than they might otherwise have done. Sometimes that has worked in our favour – Antoine Semenyo’s strong end to the season being a case in point; and sometimes it has not – Morgan Rogers, I am looking at you.
And sometimes it has thrown up anomalies where I have either had to find creative ways to break my own rules or do the decent thing and thus, for example, end up playing Burnley goalkeeper Martin Dubravka for a big chunk of the season until Arsenal’s David Raya finally overhauled him as the most-owned option in Gameweek 16. Worse still, it was only Gameweek 24 when the portfolio was finally free to own Bruno Fernandes.
And yes, I am well aware this was supposed to be an index-tracker and so, as the portfolio adviser, I should only be worried about reflecting the broader market as accurately and cost-effectively as possible. That means cramming in as many most-owned players as the budget allows and never ever burning a precious four points on an extra transfer – and that is pretty much what I have done.
Dirty little secret
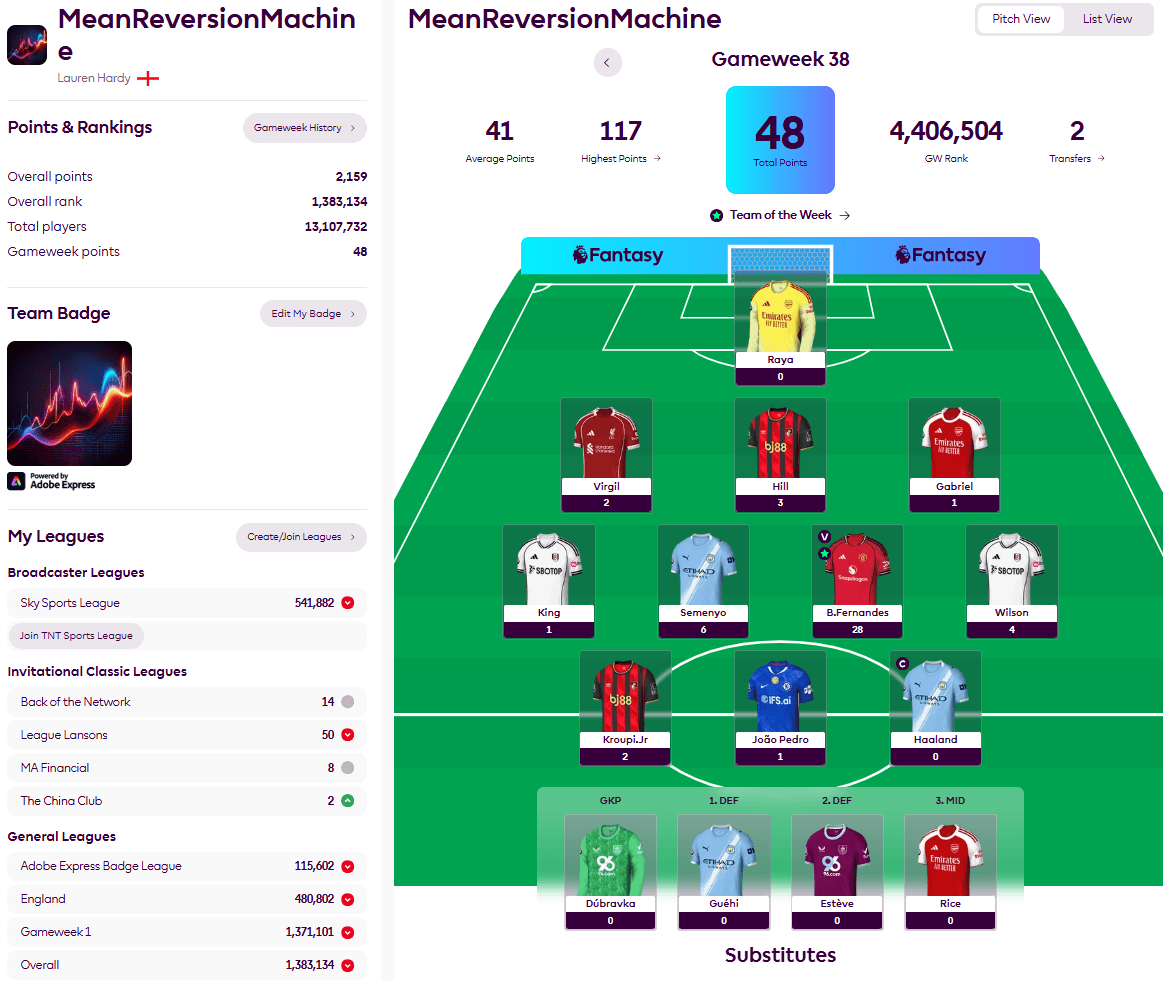
Yet the dirty little secret of the Mean Reversion Machine project – the first inklings of which occurred to me quite early on in the season – is it may very well not be a pure tracker at all. For one thing, the 2,159 points we scored was enough to rank us 1,383,134th out of a total of 13,107,732 teams – so within an ace of top-decile performance – and I do not believe that can be entirely explained by the proportion of inactive teams.
No – I have a feeling we might be in the realms of smart beta here. It could be this is because the more engaged players who stick out an entire season will make for an increasingly informed market to track. Or – and I say this with all due modesty – there are times when the portfolio rules allow me an element of discretion and it is just possible I have some idea what I am doing. Maybe.
I mean, I could certainly argue discretionary gains such as the 33 points bagged from the Gameweek 33 bench boost, say, or the 26 points gleaned via budget Bournemouth striker Junior Kroupi since he entered the portfolio in Gameweek 32 were not entirely down to luck – and, even if they were, they have still helped to distance Mean Reversion Machine from the middle part of the market.
All of which begs the question, could we finesse the experiment in 2026/27? Could we be, well, smarter? Might we, for example, set out to track the most popular players across the entire market for the first six or eight gameweeks before – and this ought to be possible – switching to track the most-owned assets of the top million or top 100,000 players.
I am genuinely unsure if that would skew the resulting portfolio’s performance up or down but it is one to ponder over a summer where I have again promised myself that – this time, this time – I will not enter any Fantast World Cup competition. For now, though, let’s take a quick look at how the portfolio did in what seemed, for many FPL managers, a pretty underwhelming final week of the season.
As flagged last week, with the Premier League title already settled, both Arsenal and Manchester City trotted out markedly rotated teams. That meant, of the former, Raya and Rice and, of the latter, Guehi and Haaland played not a single minute between them – the silver lining of that particular cloud being Bruno became our captain and thereby accounted for almost three-fifths of our total points:
“All of which begs the question, could we finesse the experiment in 2026/27? Could we be, well, smarter?
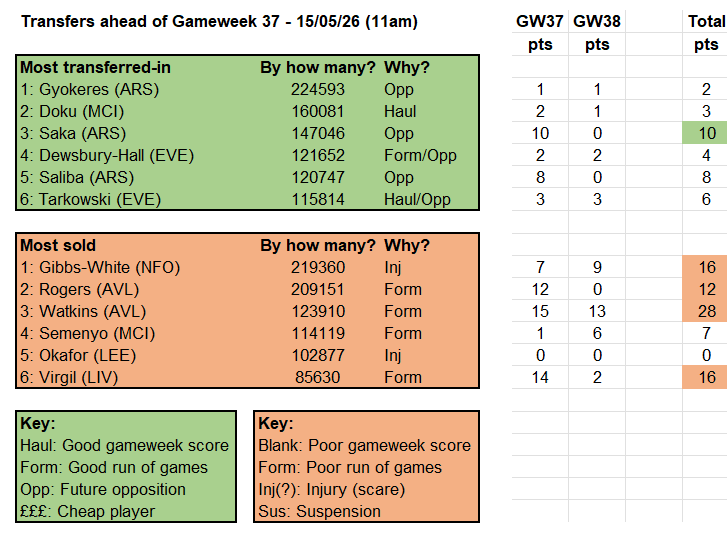
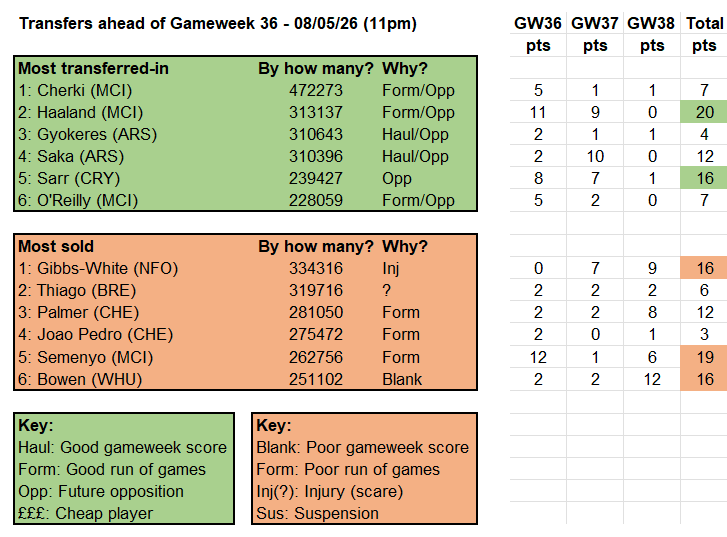
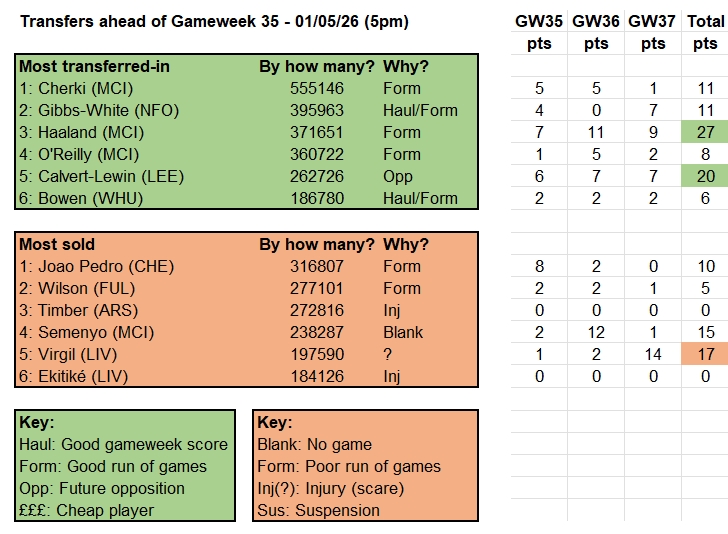
With our regular ‘Herdwatch’ tables of biggest buys and sells in recent weeks, there is an inevitable diminishing of data returns as we reach the end of the season. So I would merely direct your attention to some serious points-dodging ahead of Gameweeks 36 and 37 as managers offloaded Bowen, Rogers, Semenyo, Virgil and Watkins – perhaps in last-minute attempts to gain rank with a few ‘Hail Mary’ picks?
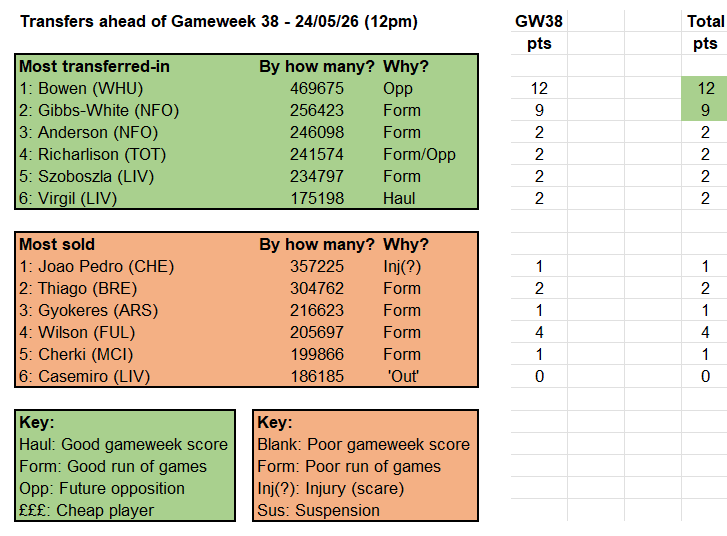
Source: Fantasy Premier League
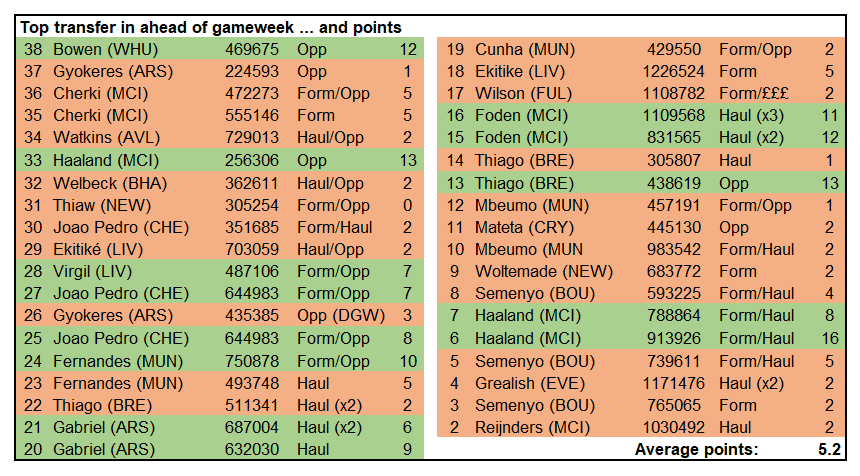
Instead, let’s end with a complete rundown of the most transferred-in player ahead of each gameweek and the immediate points gains. The green lines of the table below are where that player scored six points or more while the pink ones denote five points or less. The green lines account for 13 out of 37 gameweeks – so roughly a third – with eight coming in the second half of the season, which might add weight to my ‘informed market’ theory.
Source: Fantasy Premier League
As you can see, Haaland was responsible for three of the greens, including the highest immediate return of the season (16) while Foden and Joao Pedro recorded two each. Like Haaland and Brentford’s Thiago, Semenyo makes three appearance across the whole table but never managed to reward his backers with an immediate return of more than five points – which is entirely in line with the full 37-week average.
Indeed, after a weak last-quarter of the season for immediate returns from the week’s biggest buys, it was only Bowen’s final-week 12-pointer that stopped that average finishing up below the five mark. And I must admit that referring to that statistic each week – and indeed writing this column – did seem to add a little extra clarity or perhaps ‘pause for thought’ into my own FPL season where I went into the final week ranked about 62,000th.
OK, one might argue those two qualities went completely out of the window as I rejigged my team 10 minutes before the Gameweek 38 deadline as it became clear Haaland and O’Reilly were not even on the Manchester City bench – but, on another day, I would remember I had been tracking Manchester United’s Dorgu ever since he came back from injury and VAR would not chalk off Foden’s goal because his backside was offside.
Anyway, a final rank of 110,000th, give or take, is nothing to be ashamed of in these days of content creators, cloned teams, AI input and 13 million rivals – active or otherwise – and there is always next season. As there could be, perhaps, for a ‘smarter’ Mean Reversion Machine …